Turbulence in Jupiter's atmosphere
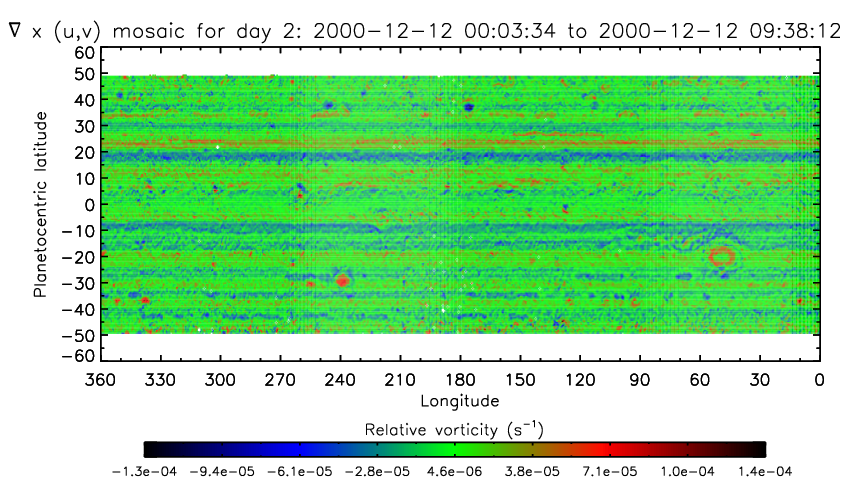
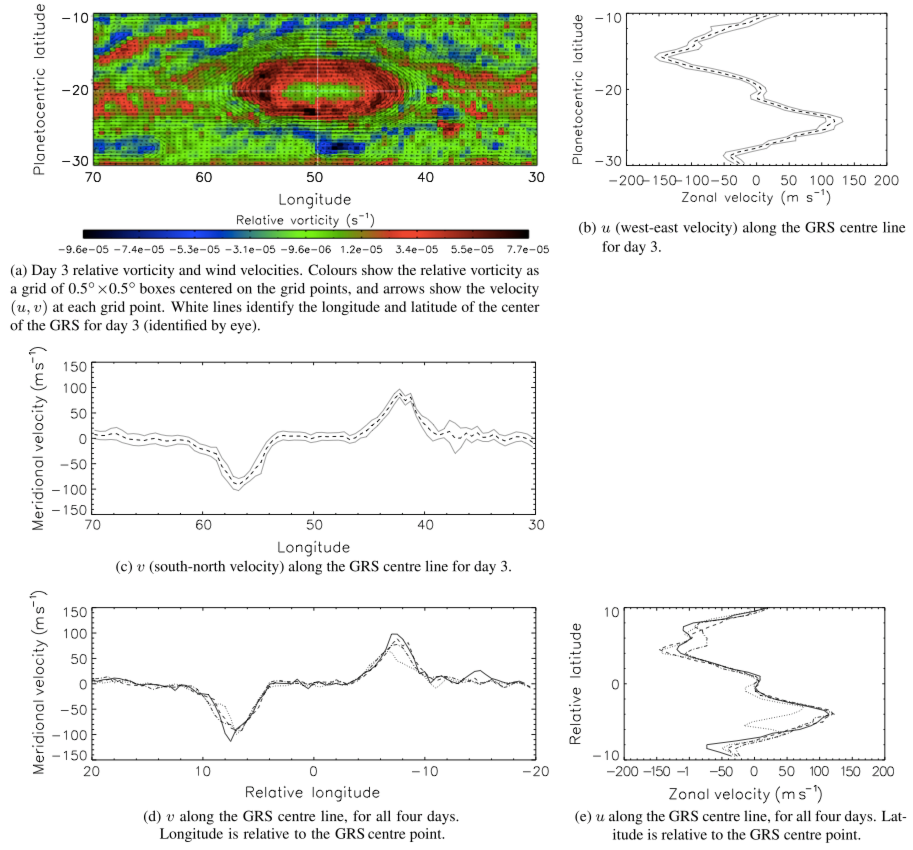
This work focuses on observational data from NASA's Cassini spacecraft, specifically the visible/near-IR data from the ISS instrument. Cassini passed Jupiter in December 2000, taking a series of global images of the planet's clouds (among many other observations). Using a method developed for laboratory experiments called Correlation Imaging Velocimetry, which tracks features between pairs of images, we have used these images to compute global maps of Jupiter's horizontal winds at cloud level.
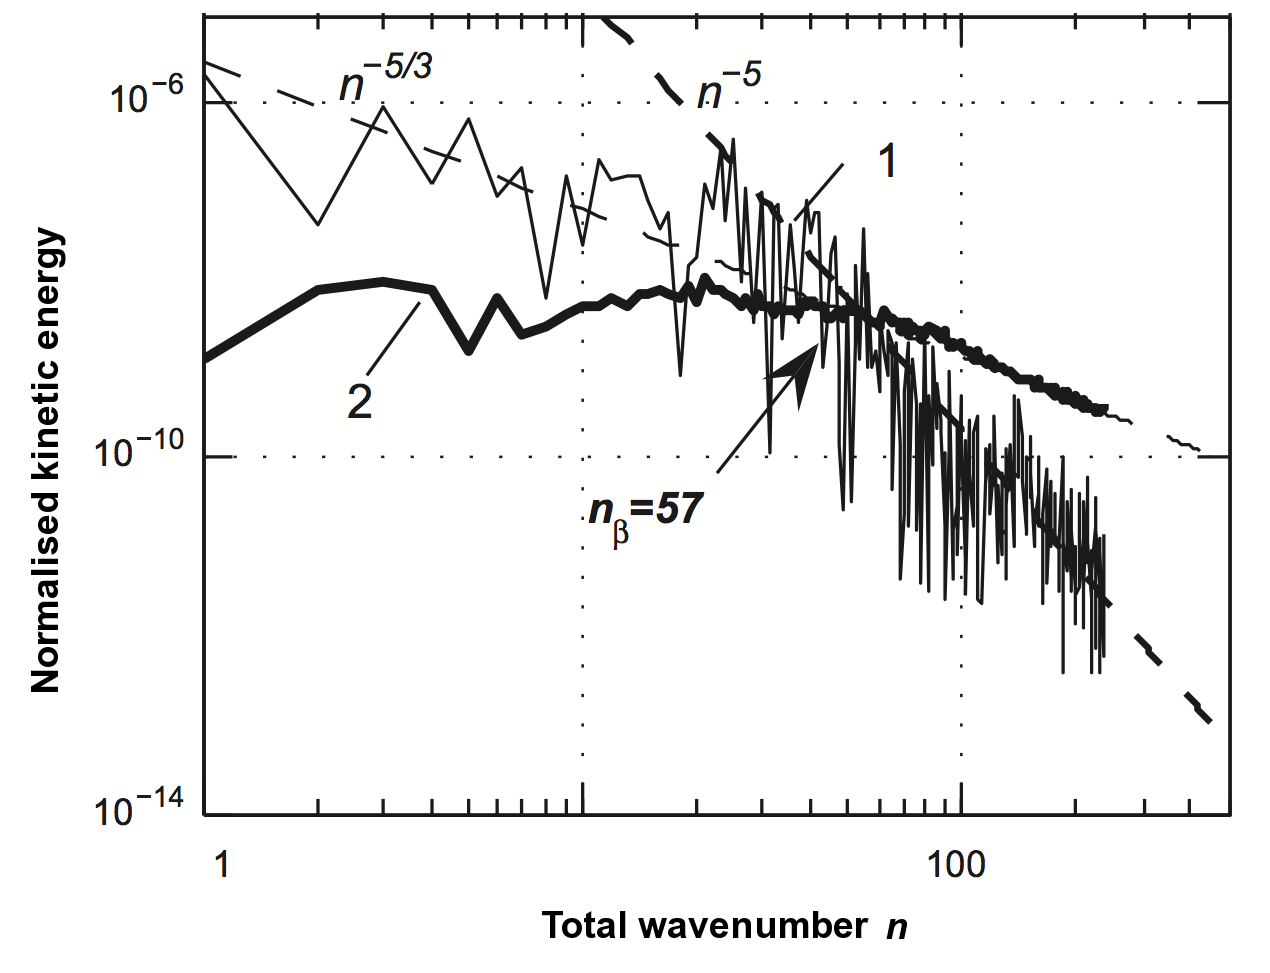
These maps have many uses but we are particularly interested in turbulence in Jupiter's weather layer. We have computed the kinetic energy spectra from the wind fields, which reveal a separation between the kinetic energy in the zonal flow, which is concentrated in the low wavenumbers with scaling n-5, and the kinetic energy in the eddies, which have a scaling close to the characteristic n-5/3 predicted by classical 2D turbulence theory. This separation of scales between the zonal and the eddy flow puts Jupiter's weather layer into the so-called zonostrophic flow regime.
In my most recent work we used these velocity fields, along with a separate dataset produced by
Choi & Showman (2011), to calculate the transfer of kinetic energy between
different length scales in Jupiter's atmosphere. We used two complementary techniques based on structure functions and spectral fluxes,
and the results were in qualitative agreement. We found evidence for an upscale cascade of kinetic energy to the jet scale, as expected,
but also a downscale cascade at small scales. The turnaround scale is around the Rossby deformation scale, which implies that
baroclinic processes appear to be important in energising Jupiter's large-scale atmospheric turbulence and jets.
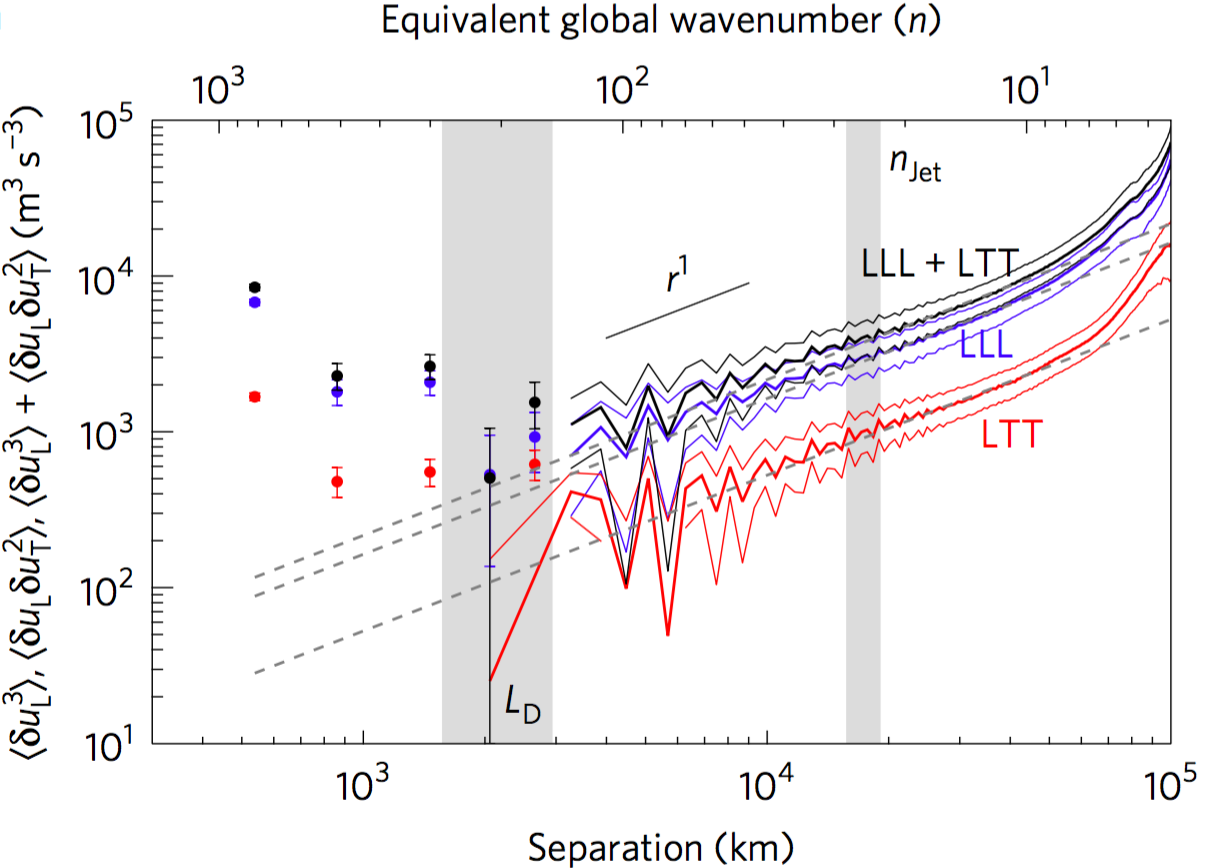
In 2D turbulent flow the 3rd order structure function varies linearly with separation distance and is positive. In 3D turbulent flow it is also linear, but negative. Here we see that the Jovian structure functions are positive between the deformation scale and the jet scale, with a good linear fit (grey dashed lines), indicating an upscale cascade. Smaller than the deformation scale the structure functions are negative (dotted values), indicating a downscale cascade, although there is not a linear dependence on separation distance.
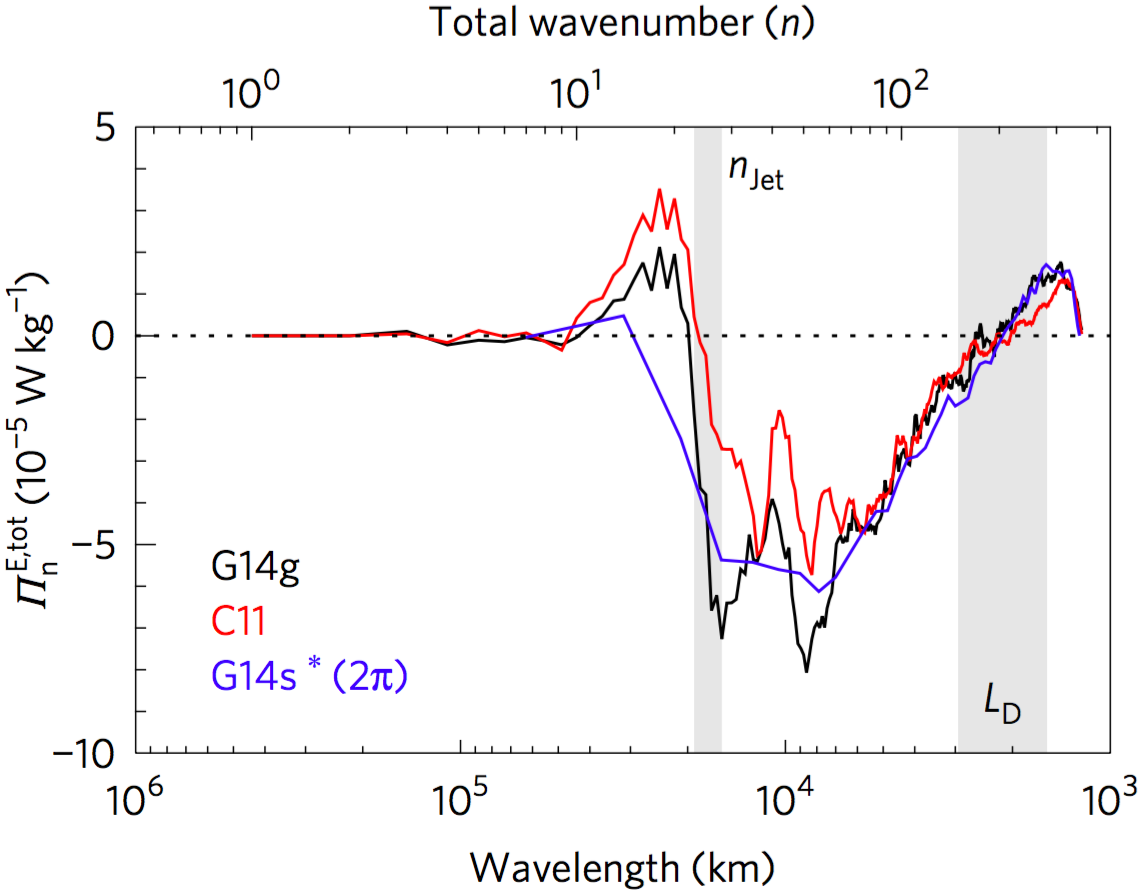
Here, a negative value implies an upscale kinetic energy flux from small to large scales, and vice versa for a positive flux. These spectral fluxes corroborate the findings from the structure functions. Between the deformation scale and the jet scale there is an upscale cascade of kinetic energy. However, at scales smaller than the deformation scale there is a downscale (forward) cascade to the smallest resolvable scales in the wind fields. The conclusions from these fluxes agree qualitatively with the structure functions. There is a source of kinetic energy at the deformation scale that diverges upscale and downscale. The magnitude of the upscale cascade flux agrees to within a factor two of the value computed from the structure functions. The conversion rate from eddy to zonal kinetic energy (not shown) peaks strongly at the jet scale.